wavespectra.SpecArray.plot#
- SpecArray.plot(kind='contourf', normalised=True, logradius=True, as_period=False, rmin=None, rmax=None, show_theta_labels=True, show_radii_labels=True, radii_ticks=None, radii_labels_angle=22.5, radii_labels_size=8, cbar_ticks=None, cmap='RdBu_r', extend='neither', efth_min=0.001, **kwargs)[source]#
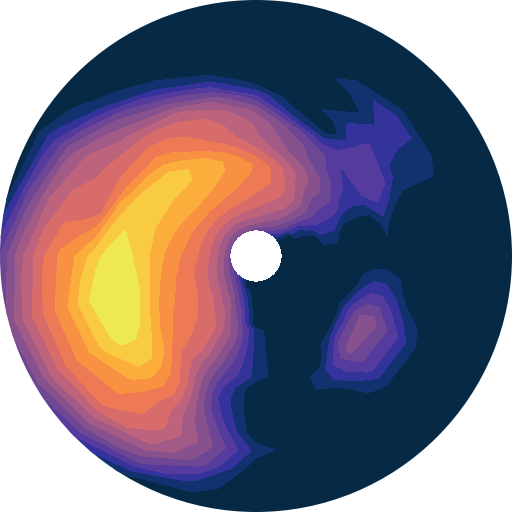
Plot spectra in polar axis.
- Parameters:
kind (-) – Plot kind, one of (contourf, contour, pcolormesh).
normalised (-) – Show efth normalised between 0 and 1.
logradius (-) – Set log radii.
as_period (-) – Set radii as wave period instead of frequency.
rmin (-) – Minimum value to clip the radius axis.
rmax (-) – Maximum value to clip the radius axis.
show_theta_labels (-) – Show direction tick labels.
show_radii_labels (-) – Show radii tick labels.
radii_ticks (-) – Tick values for radii.
radii_labels_angle (-) – Polar angle at which radii labels are positioned.
radii_labels_size (-) – Fontsize for radii labels.
cbar_ticks (-) – Tick values for colorbar.
cmap (-) – Colormap to use.
efth_min (-) – Clip energy density below this value.
kwargs (-) – All extra kwargs are passed to the plotting method defined by kind.
- Returns:
The xarray object returned by calling da.plot.{kind}(**kwargs).
- Return type:
pobj
Note
If normalised==True, contourf uses a logarithmic colour scale by default.
Plot and axes can be redefined from the returned xarray object.
Xarray uses the sharex, sharey args to control which panels receive axis labels. In order to set labels for all panels, set these to False.
Masking of low values can be done in contourf by setting efth_min larger than the lowest contour level along with extend set to “neither” or “min”.