Note
Go to the end to download the full example code.
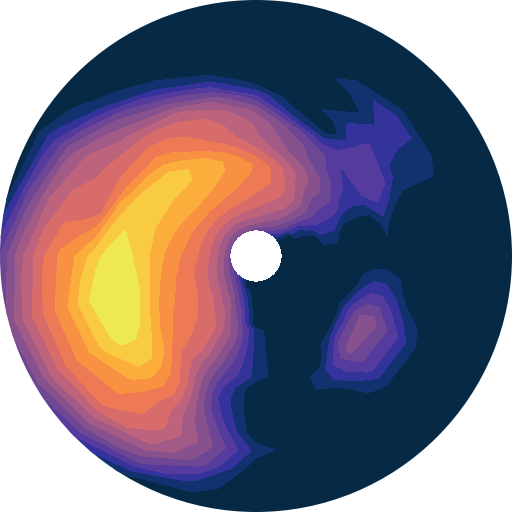
Control radius extent#
Radius extent can be defined from rmin and rmax parameters
![lon = 0.0 [degrees_east], lat = 72.0 [degrees_n...](../_images/sphx_glr_plot_spectra_slice_radius_001.png)
import matplotlib.pyplot as plt
from wavespectra import read_era5


dset = read_era5("../_static/era5file.nc")
ds = dset.isel(lat=0, lon=0, time=0)
p = ds.spec.plot(
    rmin=0,
    rmax=0.15,
    logradius=False,
    normalised=False,
    levels=25,
    cmap="gray_r",
    radii_ticks=[0.03, 0.06, 0.09, 0.12, 0.15],
    radii_labels_angle=120,
    radii_labels_size=7,
)
Total running time of the script: (0 minutes 0.198 seconds)