Note
Go to the end to download the full example code.
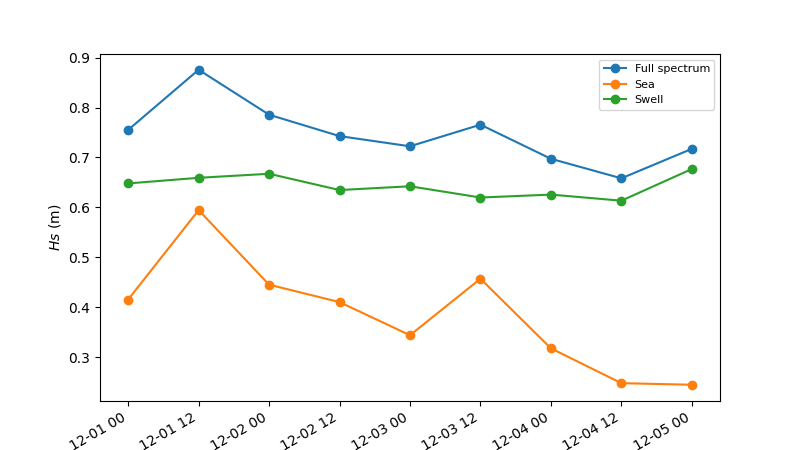
Frequency-split parameters#
Split spectra and plot parameters
Text(0.5, 20.222222222222214, '')
import matplotlib.pyplot as plt
from wavespectra import read_ww3


dset = read_ww3("../_static/ww3file.nc")

fcut = 1 / 8
sea = dset.efth.spec.split(fmin=fcut)
swell = dset.efth.spec.split(fmax=fcut)

plt.figure(figsize=(8, 4.5))
p1 = dset.spec.hs().isel(site=0).plot(label="Full spectrum", marker="o")
p2 = sea.spec.hs().isel(site=0).plot(label="Sea", marker="o")
p3 = swell.spec.hs().isel(site=0).plot(label="Swell", marker="o")
l = plt.legend(loc=0, fontsize=8)
plt.title("")
plt.ylabel("$Hs$ (m)")
plt.xlabel("")
Total running time of the script: (0 minutes 0.160 seconds)