Note
Go to the end to download the full example code.
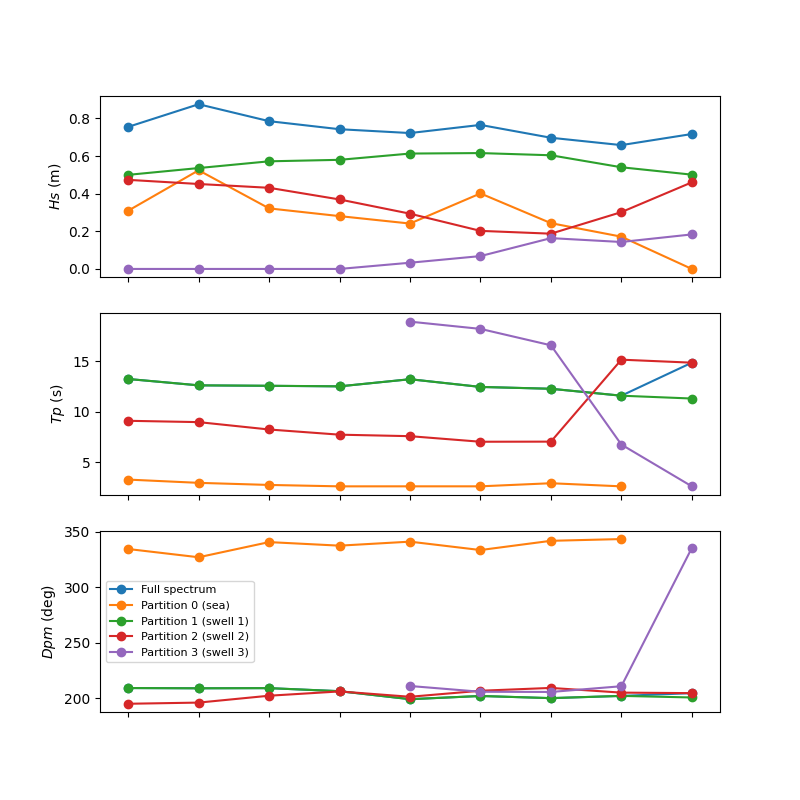
Watershed parameters#
Partition spectra and plot parameters
/home/docs/checkouts/readthedocs.org/user_builds/wavespectra/checkouts/latest/docs/gallery/plot_watershed_sea_swell.py:15: FutureWarning: Partitioning from the Dataset accessor will return a Dataset preserving the non-spectral variables in wavespectra 5.0. Opt in to the future behaviour with `wavespectra.set_options(dataset_transforms=True)`, or partition from the DataArray accessor, e.g. `dset.efth.spec.partition`, to retain the current behaviour and silence this warning.
  dspart = dset.spec.partition.ptm1(dset.wspd, dset.wdir, dset.dpt)
import matplotlib.pyplot as plt
from wavespectra import read_ww3


dset = read_ww3("../_static/ww3file.nc")

dspart = dset.spec.partition.ptm1(dset.wspd, dset.wdir, dset.dpt)
pstats = dspart.spec.stats(["hs", "tp", "dpm"])

fig, (ax1, ax2, ax3) = plt.subplots(3, 1, figsize=(8, 8))

# Hs
p1 = dset.spec.hs().isel(site=0).plot(ax=ax1, label="Full spectrum", marker="o")
p2 = pstats.hs.isel(part=0, site=0).plot(ax=ax1, label="Partition 0 (sea)", marker="o")
p3 = pstats.hs.isel(part=1, site=0).plot(
    ax=ax1, label="Partition 1 (swell 1)", marker="o"
)
p4 = pstats.hs.isel(part=2, site=0).plot(
    ax=ax1, label="Partition 2 (swell 2)", marker="o"
)
p5 = pstats.hs.isel(part=3, site=0).plot(
    ax=ax1, label="Partition 3 (swell 3)", marker="o"
)
ax1.set_ylabel("$Hs$ (m)")

# Tp
p5 = dset.spec.tp().isel(site=0).plot(ax=ax2, label="Full spectrum", marker="o")
p6 = pstats.tp.isel(part=0, site=0).plot(ax=ax2, label="Partition 0 (sea)", marker="o")
p7 = pstats.tp.isel(part=1, site=0).plot(
    ax=ax2, label="Partition 1 (swell 1)", marker="o"
)
p8 = pstats.tp.isel(part=2, site=0).plot(
    ax=ax2, label="Partition 2 (swell 2)", marker="o"
)
p9 = pstats.tp.isel(part=3, site=0).plot(
    ax=ax2, label="Partition 3 (swell 3)", marker="o"
)
ax2.set_ylabel("$Tp$ (s)")

# Dpm
p10 = dset.spec.dpm().isel(site=0).plot(ax=ax3, label="Full spectrum", marker="o")
p11 = pstats.dpm.isel(part=0, site=0).plot(
    ax=ax3, label="Partition 0 (sea)", marker="o"
)
p12 = pstats.dpm.isel(part=1, site=0).plot(
    ax=ax3, label="Partition 1 (swell 1)", marker="o"
)
p13 = pstats.dpm.isel(part=2, site=0).plot(
    ax=ax3, label="Partition 2 (swell 2)", marker="o"
)
p14 = pstats.dpm.isel(part=3, site=0).plot(
    ax=ax3, label="Partition 3 (swell 3)", marker="o"
)
ax3.set_ylabel("$Dpm$ (deg)")

l = plt.legend(loc=0, fontsize=8)

for ax in [ax1, ax2, ax3]:
    ax.set_title("")
    ax.set_xlabel("")
    ax.set_xticklabels([])
Total running time of the script: (0 minutes 0.506 seconds)