Note
Go to the end to download the full example code.
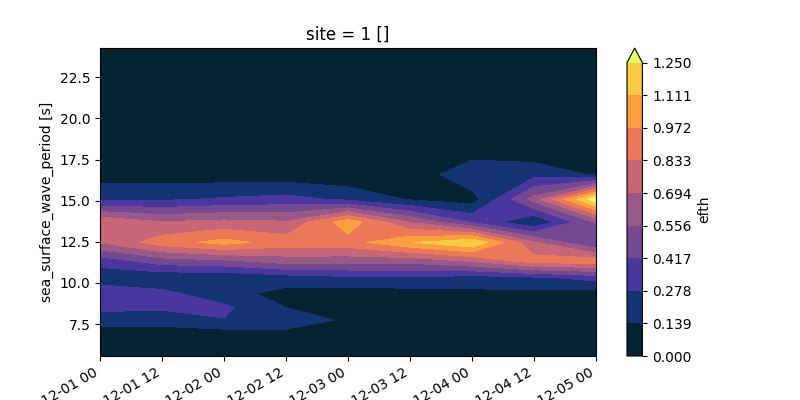
Hovmoller diagram of spectra time series#
Integrate spectra and plot as Hovmoller diagram
import matplotlib.pyplot as plt
import cmocean
from wavespectra import read_ww3


fig = plt.figure(figsize=(8, 4))

dset = read_ww3("../_static/ww3file.nc")
ds = dset.isel(site=0).efth.spec.split(fmax=0.18)
ds = ds.spec.oned().rename({"freq": "period"})
ds = ds.assign_coords({"period": 1 / ds.period})
ds.period.attrs.update({"standard_name": "sea_surface_wave_period", "units": "s"})
p = ds.plot.contourf(
    x="time", y="period", vmax=1.25, cmap=cmocean.cm.thermal, levels=10
)
Total running time of the script: (0 minutes 0.125 seconds)