Note
Go to the end to download the full example code.
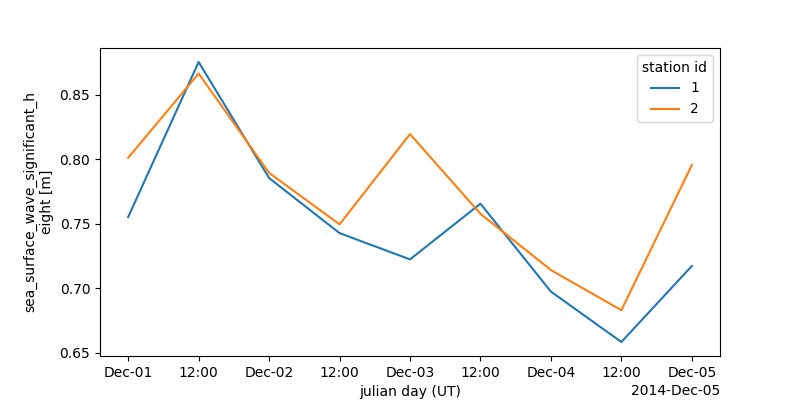
Calculate and plot Hs#
Plots Hs calculated from spectra dataset
import matplotlib.pyplot as plt
from wavespectra import read_ww3


dset = read_ww3("../_static/ww3file.nc")

fig = plt.figure(figsize=(8, 4))
hs = dset.spec.hs()
p = hs.plot.line(x="time")
Total running time of the script: (0 minutes 0.331 seconds)