Note
Go to the end to download the full example code.
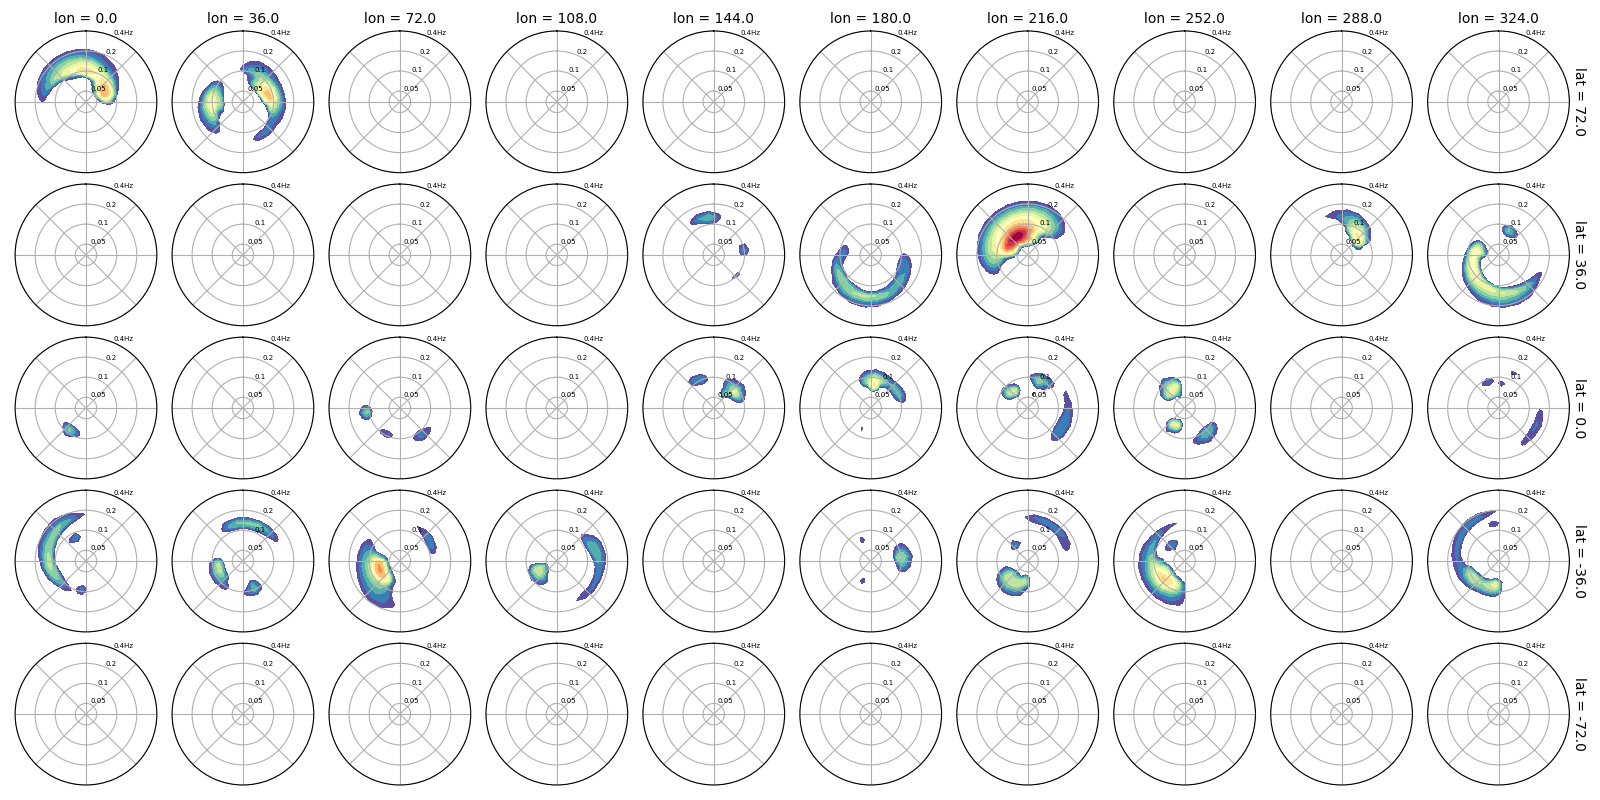
Faceting capability#
Faceting capability from xarray is supported
import numpy as np
import matplotlib.pyplot as plt
from wavespectra import read_era5


dset = read_era5("../_static/era5file.nc").isel(time=0)
p = dset.spec.plot(
    col="lon",
    row="lat",
    figsize=(16, 8),
    add_colorbar=False,
    show_theta_labels=False,
    show_radii_labels=True,
    radii_ticks=[0.05, 0.1, 0.2, 0.4],
    rmax=0.4,
    radii_labels_size=5,
    cmap="Spectral_r",
)
plt.tight_layout()
Total running time of the script: (0 minutes 10.840 seconds)